a close up of a computer screen with a chart on it

Master Trading with Powerful Insights

Explore trading logic and algorithms for successful trading decisions and insights into technical indicators.

Empowering Traders Through Insights

At Edge Technology Solutions, we are passionate about researching trading logic and algorithms, providing valuable insights into technical indicators to help you make informed trading decisions.

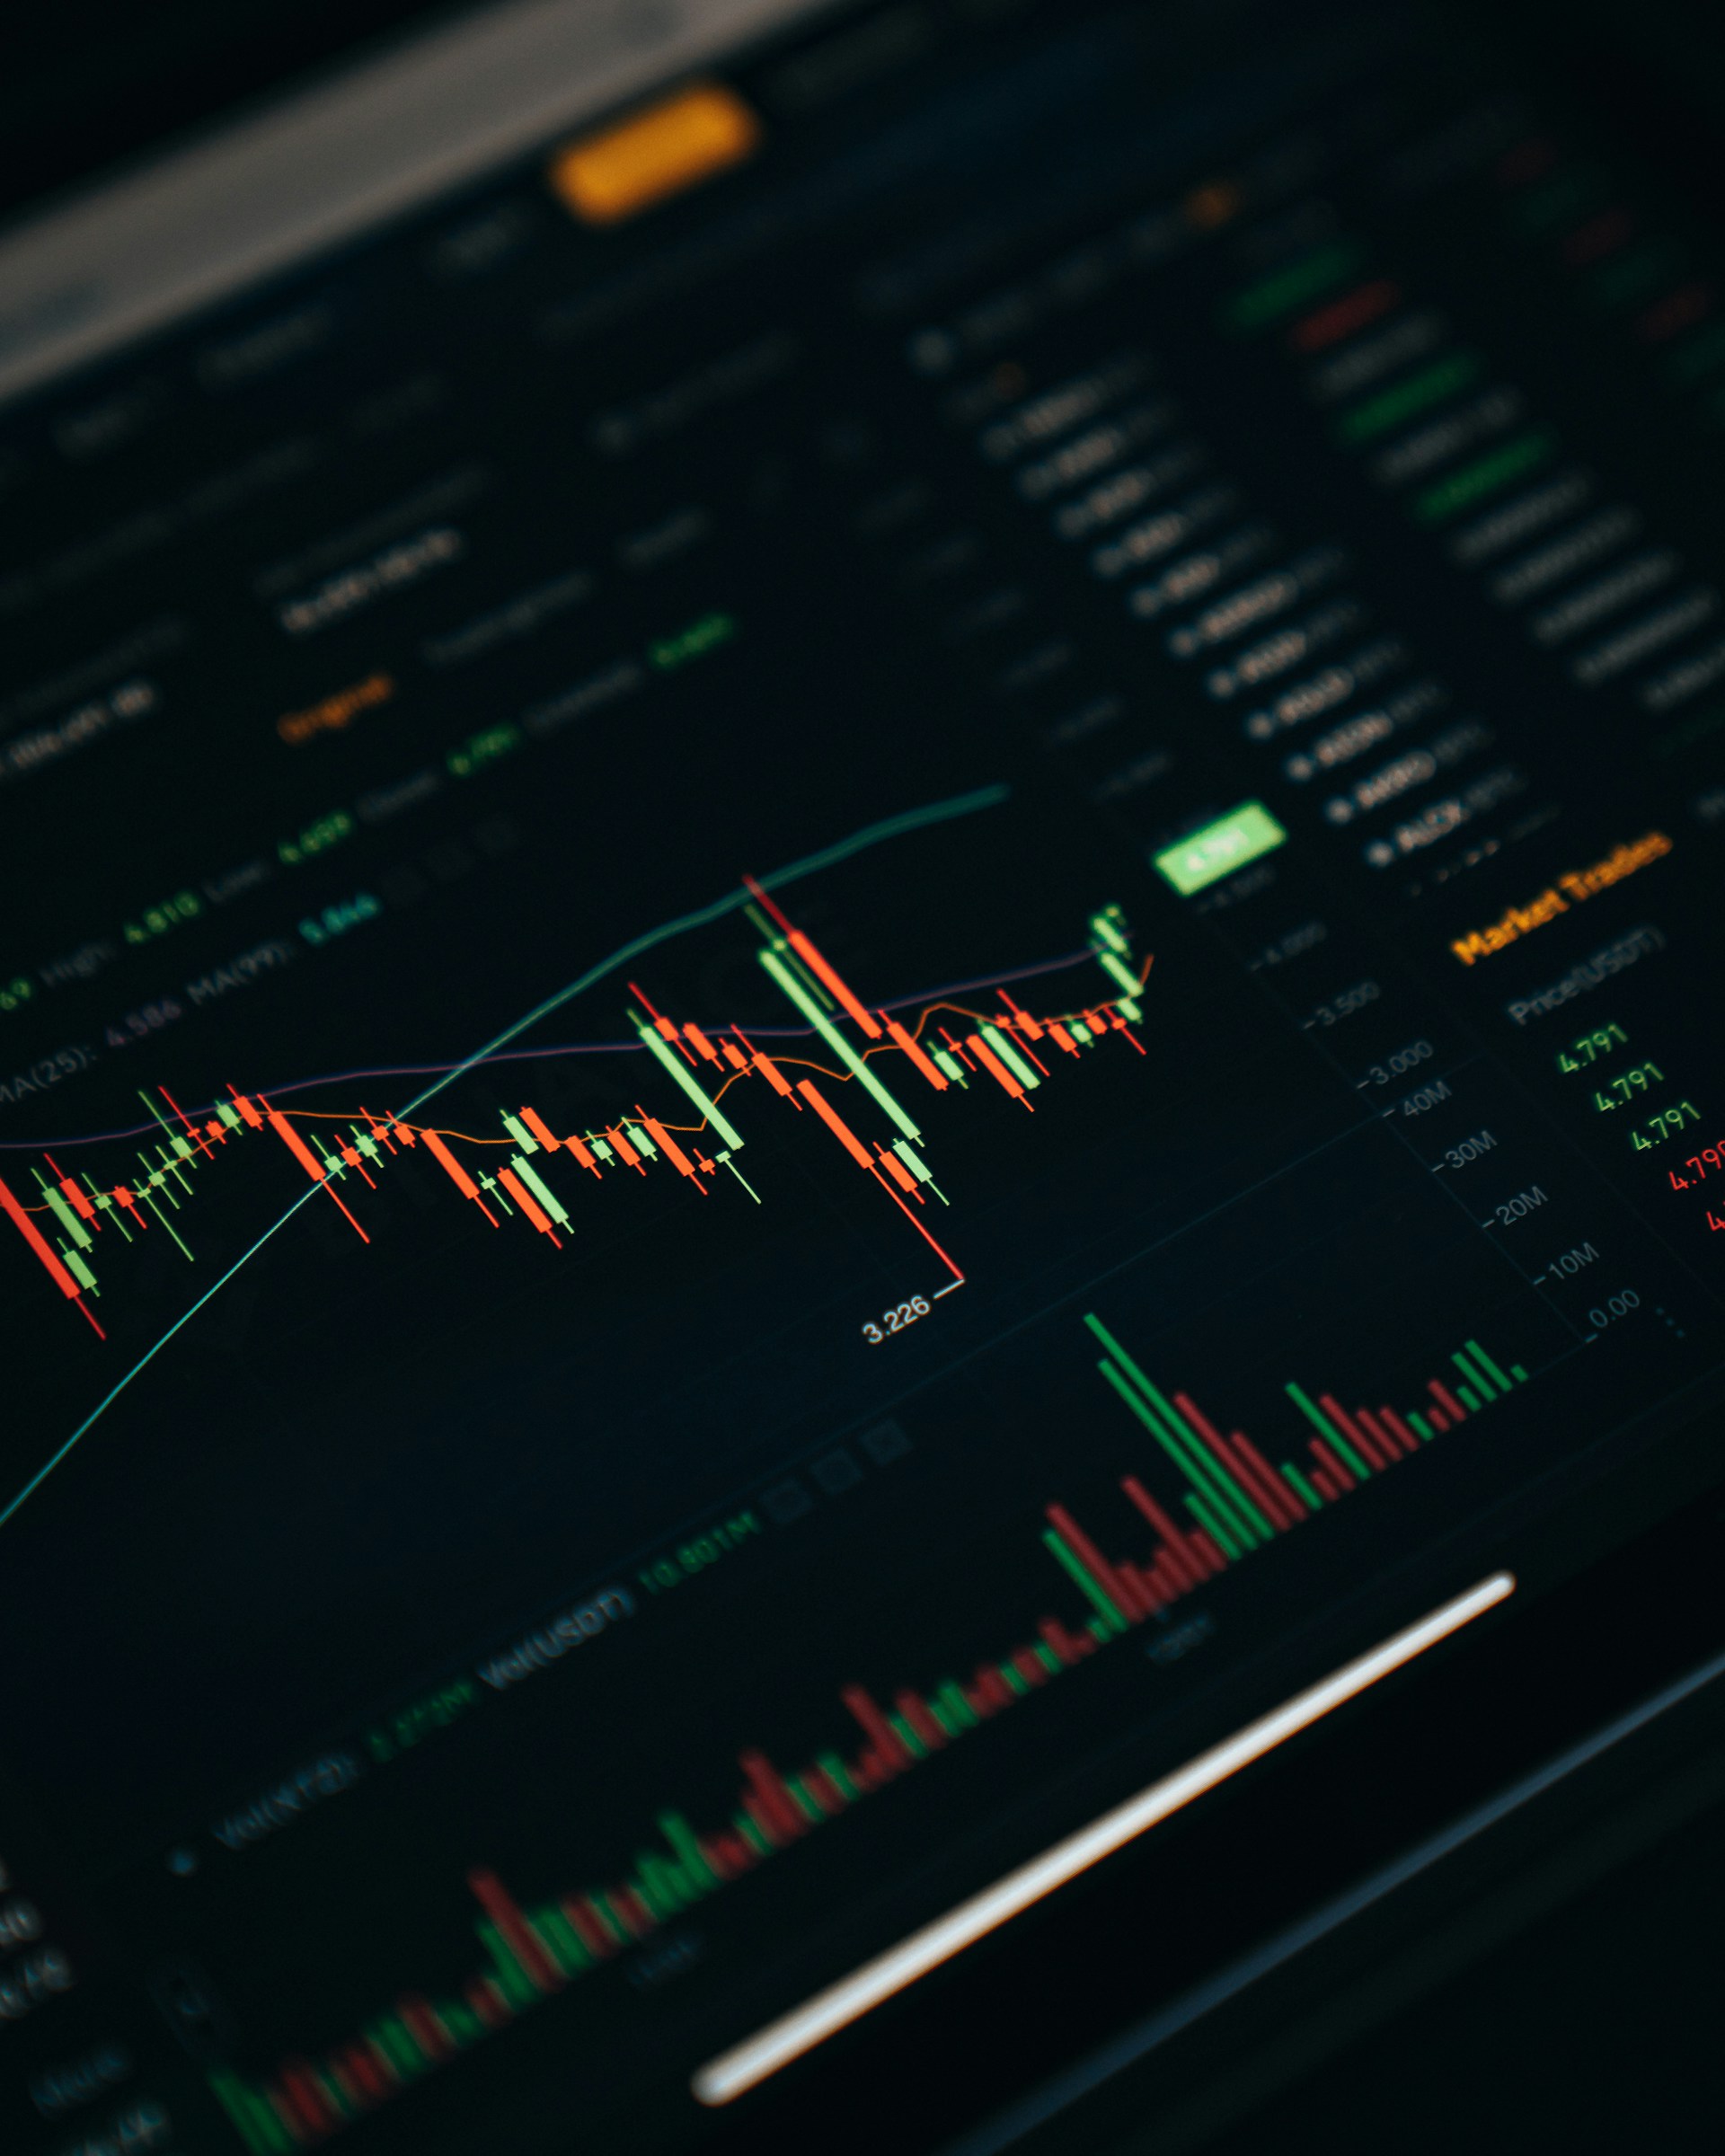
A tablet displaying a detailed digital financial trading interface with various graphs, charts, and numerical data. The screen shows candlestick charts with green and red indicators, illustrating market trends and stock prices.
Our Mission
Who We Are

Our team of enthusiasts is dedicated to exploring the complexities of trading, ensuring that you have the knowledge and tools necessary to become a successful trader in today's dynamic market.

Trading Insights Hub

Explore powerful trading algorithms and indicators to enhance your trading decisions and success.

A computer monitor displays a cryptocurrency exchange interface with various graphs, charts, and numerical data. On the left side, there are options for buying and selling, as well as a list of recent trades. The main graph on the right shows a price chart with a candlestick pattern, indicating fluctuations in the market over a period of time.
A laptop displays a financial trading platform with a candlestick chart showing stock market data. The chart is colorful, with blue and orange bars representing volume, and fluctuating lines indicating stock prices over time. Surrounding the laptop are two small potted plants on a white surface.
Algorithm Research

In-depth analysis of trading algorithms that empower traders to make informed decisions and strategies.

Technical Indicators

Discover essential technical indicators that guide traders in navigating the complexities of the market.

Get in Touch

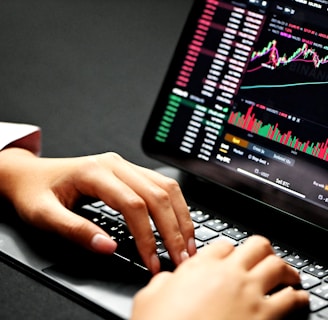
Hands typing on a laptop keyboard with a screen displaying financial graphs and stock market data. Multiple charts and numbers are visible, indicating online trading or financial analysis.

Reach out to us for insights on trading algorithms and technical indicators to enhance your trading success.